E-Commerce Analytics: Olist Brazilian Marketplace
This project analyzes 100,000 orders from Olist, a Brazilian e-commerce marketplace that connects small sellers to customers — structurally similar to Amazon's third-party marketplace. Using SQL as the primary analytical tool, I answer six business questions relevant to marketplace economics: growth trends, revenue concentration, fulfillment performance, customer retention, seller competition, and the relationship between operational failures and customer satisfaction.
All SQL queries were written in DuckDB via Python. Charts were generated with matplotlib. Full code is available on GitHub.
Data
The dataset contains 8 relational tables covering orders, customers, products, sellers, payments, and reviews from September 2016 through October 2018. The analysis focuses on January 2017 through August 2018 — the period with complete monthly data — covering 88,358 delivered orders across 71 product categories.
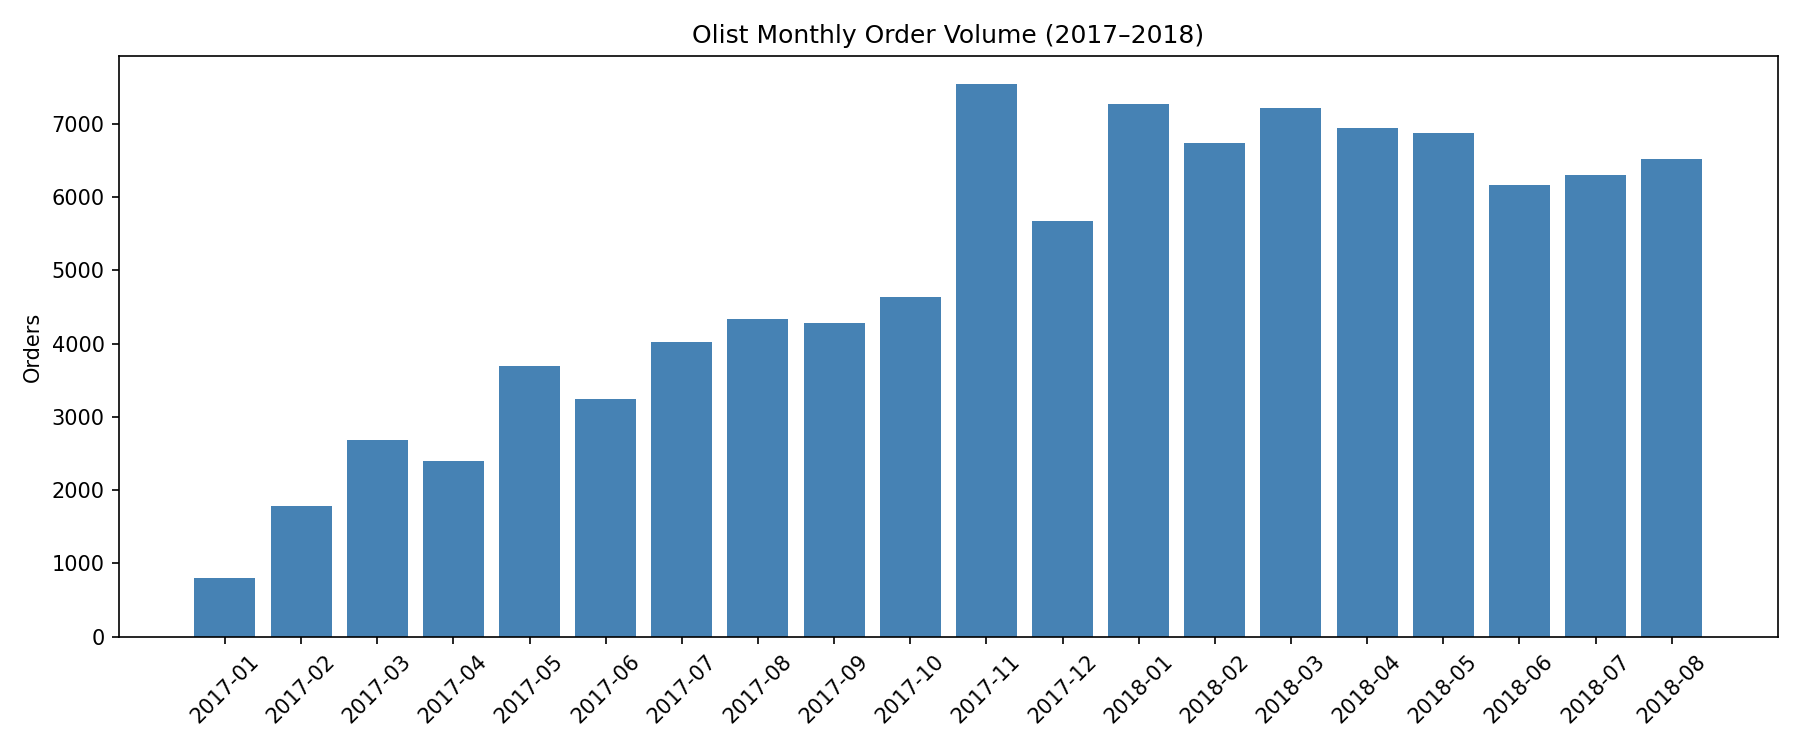
Question 1: How did order volume grow month-over-month?
The business grew from 800 orders in January 2017 to roughly 6,500–7,500 per month by mid-2018 — nearly a 10x increase in 20 months. Growth was volatile early on as the platform scaled, stabilizing to low single-digit monthly changes by 2018, consistent with a maturing marketplace. November 2017 stands out with 63% month-over-month growth, driven by Black Friday demand. December reversed sharply (-25%), the typical post-holiday pattern.
SQL approach: GROUP BY year and month to count orders per period, then use a CTE with LAG() window function to pull the prior month's count onto each row for growth rate calculation.
WITH monthly_orders AS (
  SELECT
    YEAR(order_purchase_timestamp)  AS year,
    MONTH(order_purchase_timestamp) AS month,
    COUNT(*) AS order_count
  FROM orders
  WHERE order_purchase_timestamp BETWEEN '2017-01-01' AND '2018-08-31'
  GROUP BY year, month
)
SELECT
  year, month, order_count,
  LAG(order_count) OVER (ORDER BY year, month) AS prev_month,
  ROUND((order_count - LAG(order_count) OVER (ORDER BY year, month))
    * 100.0 / LAG(order_count) OVER (ORDER BY year, month), 2) AS mom_growth
FROM monthly_orders
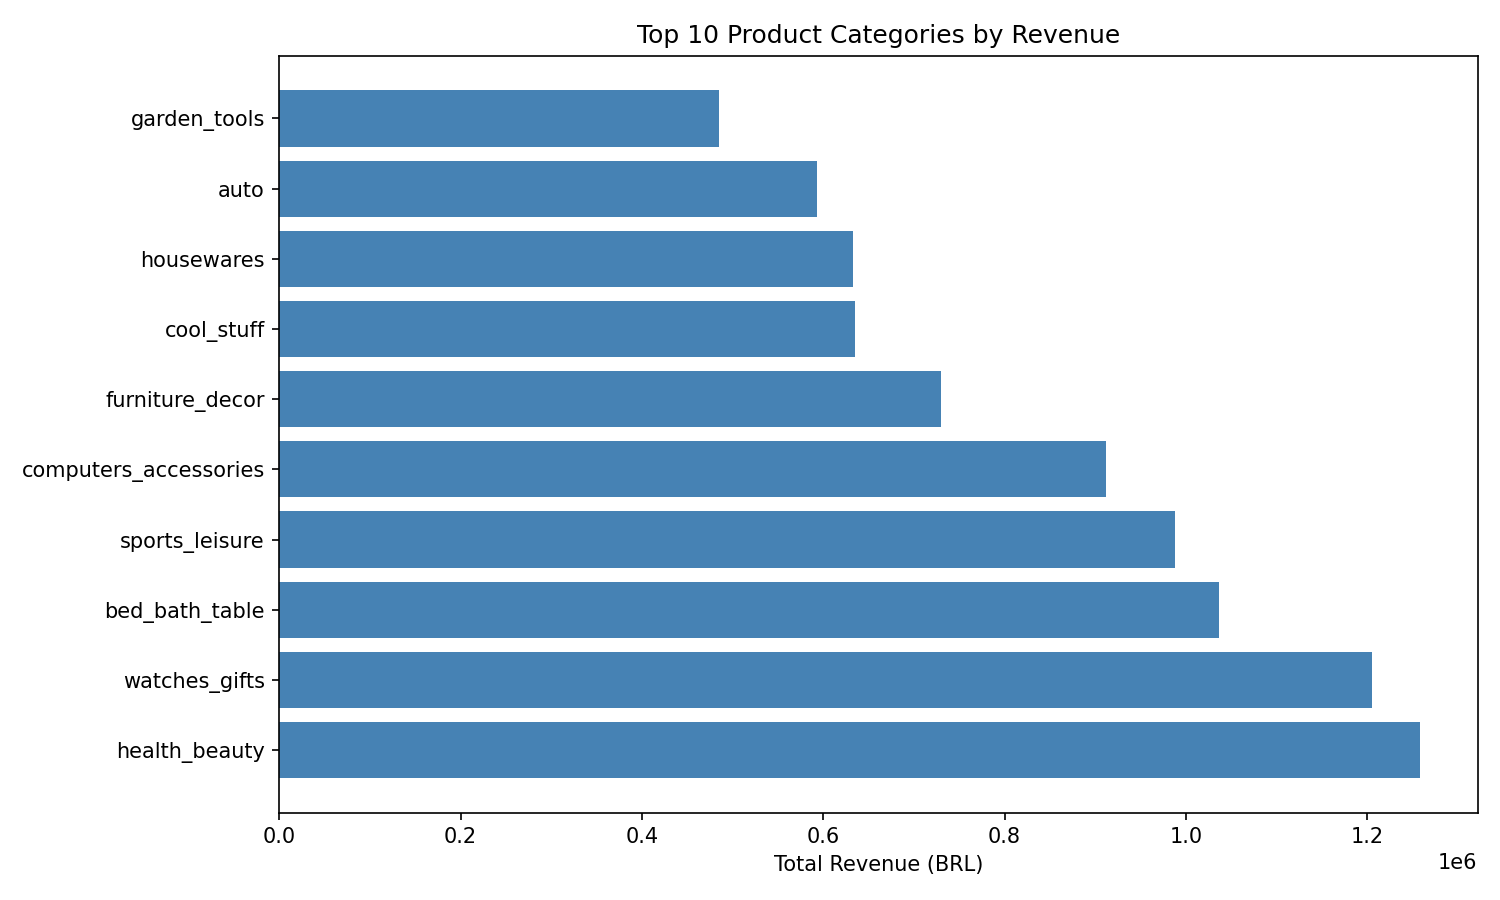
Question 2: Which product categories generate the most revenue?
Health & beauty leads all categories with R$1.26M in total revenue, followed by watches & gifts (R$1.21M) and bed, bath & table (R$1.04M). The top 10 categories account for a disproportionate share of platform revenue, consistent with the long-tail distribution typical of marketplace platforms. This query required joining three tables: order items (price), products (category ID), and a category translation table (English names).
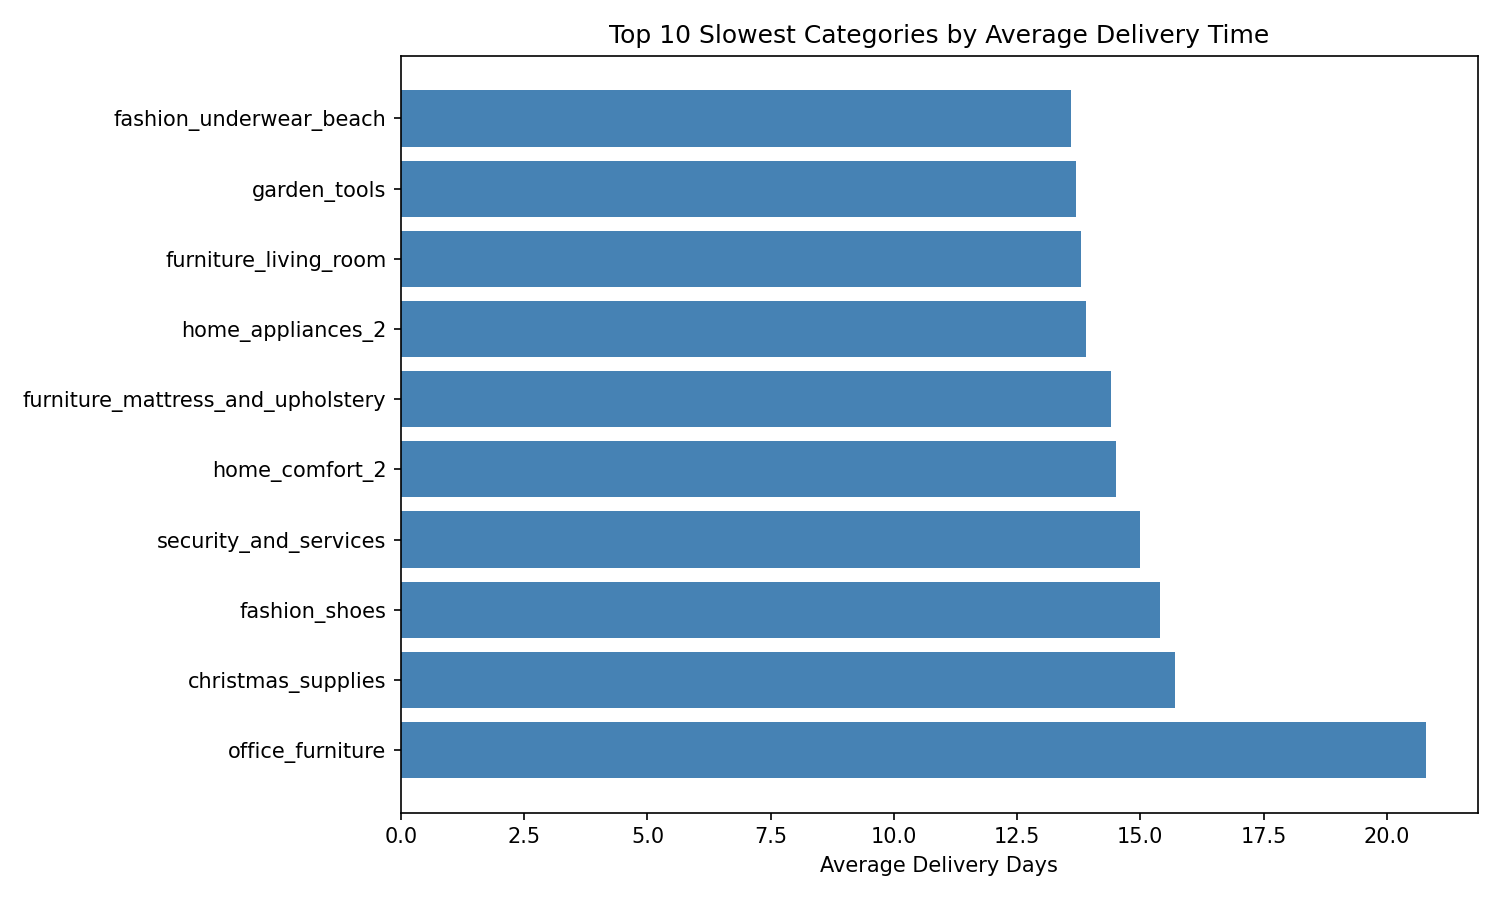
Question 3: Which categories have the worst delivery times?
Office furniture takes an average of 20.8 days from order to delivery — roughly 50% longer
than most categories. Bulky, difficult-to-ship categories cluster at the top of the slowness
ranking while fashion and smaller goods deliver faster. Garden tools appears in both the top
revenue list and the slow delivery list, suggesting a high-demand category with fulfillment
challenges. Calculated using DATEDIFF('day', order_purchase_timestamp, order_delivered_customer_date)
across a 4-table join.
Question 4: What share of customers made repeat purchases?
Only 2,997 of 96,096 unique customers placed more than one order during the 20-month period — well below the 20–40% industry benchmark for e-commerce platforms. The low rate reflects Olist's position as a discovery marketplace: customers found a seller, completed a transaction, and did not return. This is the core retention problem Amazon solved with Prime — giving customers a structural reason to default to the platform for repeat purchases.
Data quality note: the orders table contains a customer_id field
that is unique per order, not per customer — a common schema trap that initially returned a
0% repeat rate. The correct identifier is customer_unique_id in the customers
table, identified after diagnosing the discrepancy.
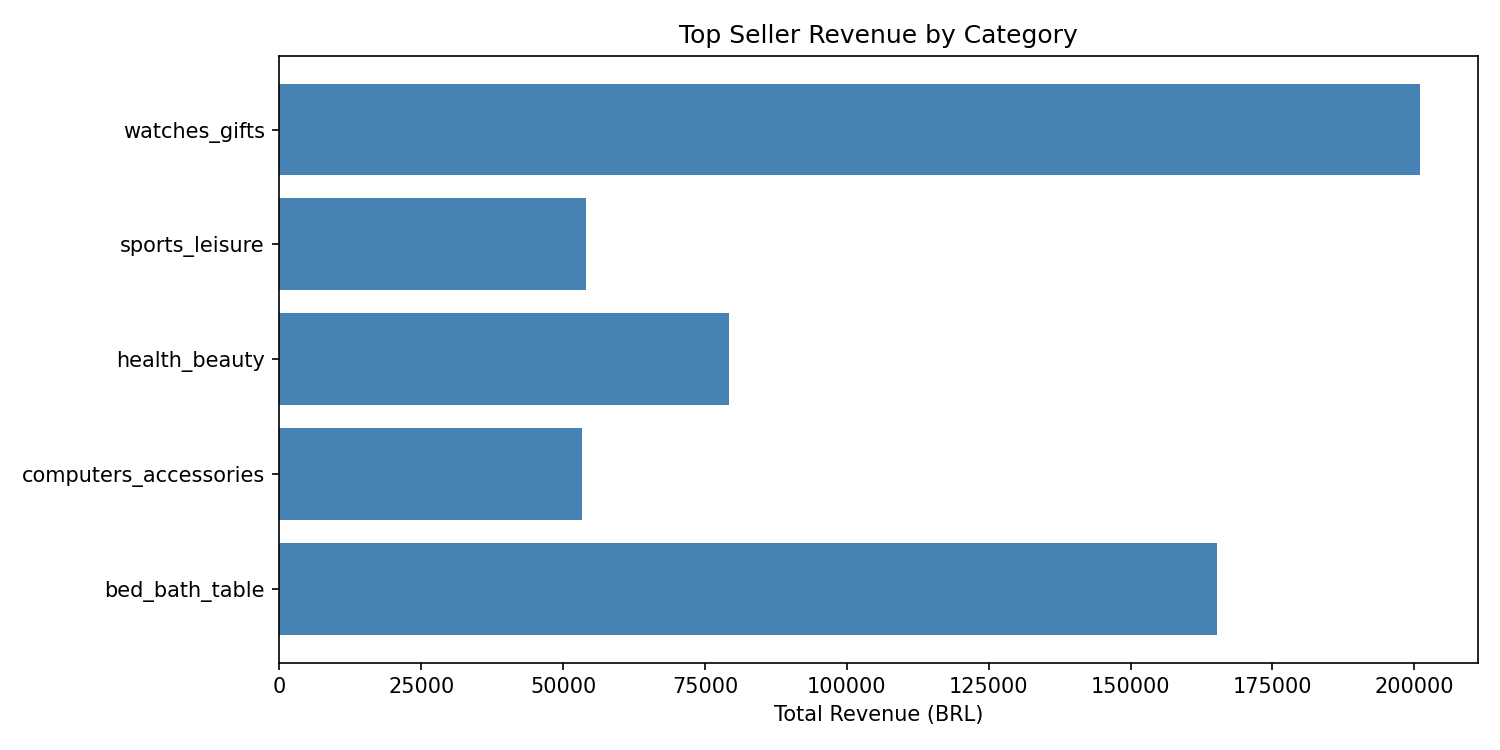
Question 5: How do sellers rank within each product category?
Using RANK() OVER (PARTITION BY category ORDER BY total_revenue DESC) to rank
sellers within each category reveals significant concentration. In watches & gifts, the
top seller generated R$201,000 — closely matched by the second-place seller at R$192,000,
indicating a competitive category. In smaller categories, the top seller often dominates
by a wide margin. The query uses two stacked CTEs: the first aggregates revenue per seller
per category, the second applies the window function, and the outer query filters to the
top 3 per category.
WITH seller_revenue AS (
  SELECT
    items.seller_id,
    cat.product_category_name_english AS category,
    ROUND(SUM(items.price), 2)        AS total_revenue
  FROM order_items AS items
  JOIN products ON items.product_id = products.product_id
  JOIN category_translation AS cat
    ON products.product_category_name = cat.product_category_name
  GROUP BY items.seller_id, cat.product_category_name_english
),
ranked AS (
  SELECT *,
    RANK() OVER (PARTITION BY category ORDER BY total_revenue DESC) AS revenue_rank
  FROM seller_revenue
)
SELECT * FROM ranked WHERE revenue_rank <= 3
ORDER BY category, revenue_rank
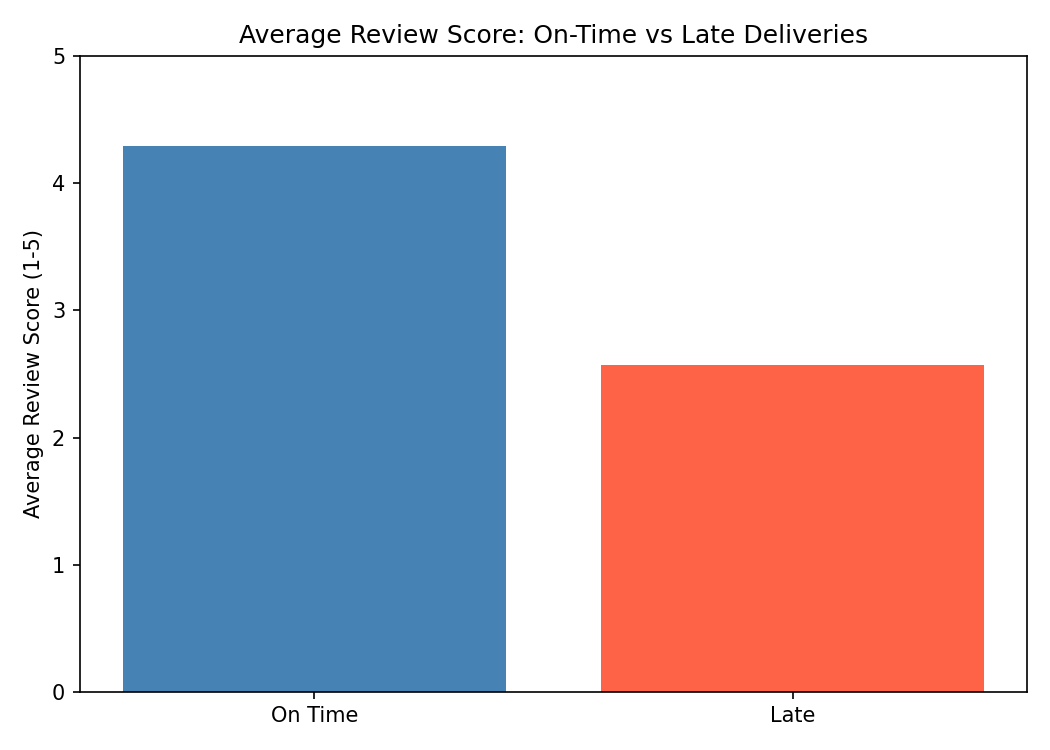
Question 6: Do late deliveries cause bad reviews?
| Delivery Status | Avg Review Score | Order Count |
|---|---|---|
| On time | 4.29 / 5 | 88,658 |
| Late | 2.57 / 5 | 7,701 |
Late deliveries are associated with a 1.72-point drop in average review score — a 40% decline in customer satisfaction from a single operational failure. With 7,701 late orders (roughly 8% of delivered orders), this represents a significant and quantifiable drag on platform reputation. This finding mirrors Amazon's internal emphasis on delivery promise accuracy as a primary driver of customer trust: fulfillment reliability is not a logistics metric — it is a customer experience metric.
Summary
Olist grew rapidly through 2017–2018 but exhibited structural weaknesses common to early-stage marketplace platforms: low customer retention (3.1% vs 20–40% industry benchmark), fulfillment reliability problems in heavy categories, and revenue concentration in a small number of categories and sellers. The data quantifies the cost of these weaknesses — particularly the direct link between late delivery and customer satisfaction — and points toward the interventions that marketplace operators use to address them: loyalty incentives, seller fulfillment standards, and category-specific logistics investment.