Silver Price: Highest Price per Troy Ounce in April 2026
The Question
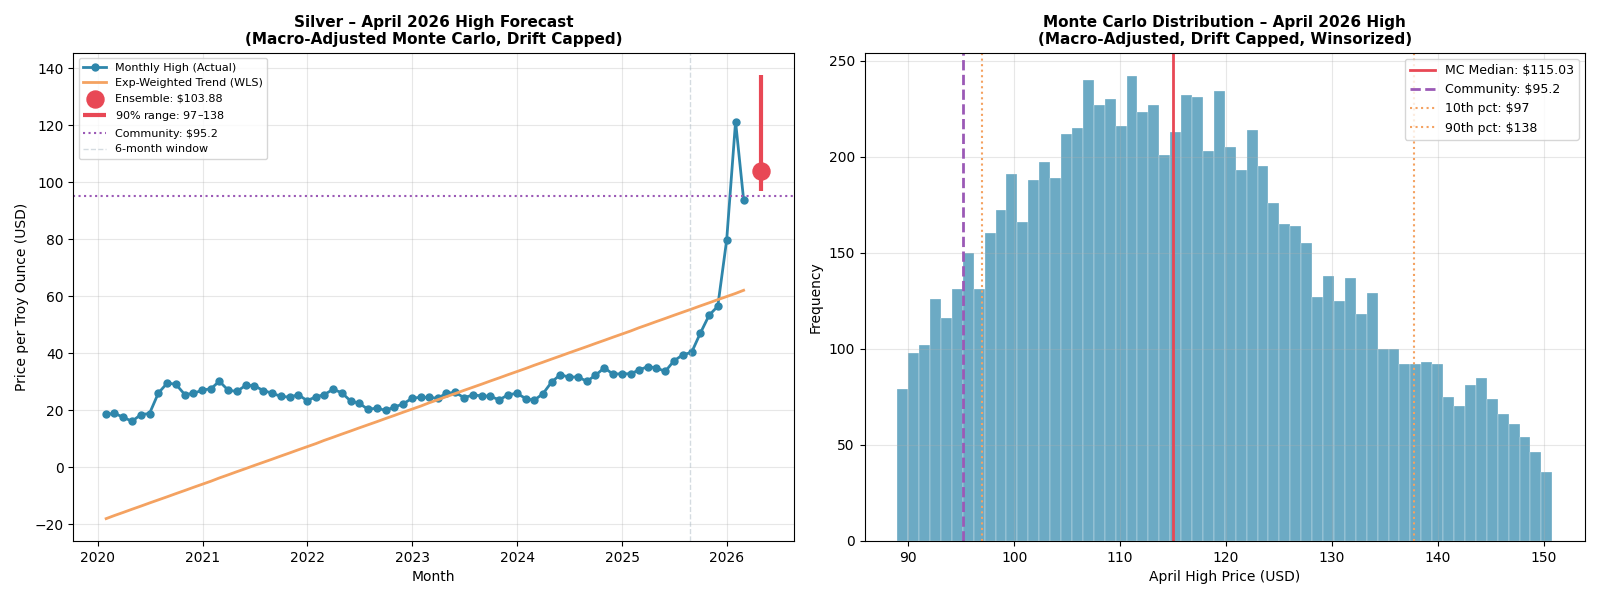
What will be the highest price of silver per troy ounce during April 2026? This is a Metaculus Cup Spring 2026 tournament question with 96 forecasters and a community median of $95.2 at time of submission. Silver's closing price on February 27, 2026 was $92.68.
Why the Community Median of $95.2 Is Puzzling
Silver closed at $92.68 on February 27. The community median of $95.2 implies the highest price silver will reach in all of April is just $2.52 above today's price — essentially zero upside over two months in a market with 83% annualized volatility. The most likely explanation is anchoring: forecasters see a historically high price, remember the January spike and crash, and anchor their distribution around current levels. This model is designed to fight that instinct.
What's Driving Silver in 2026
Three structural forces converged simultaneously that have never all been true at once: the US added silver to its Critical Minerals List in late 2025; China implemented export licensing restrictions on refined silver in January 2026, fragmenting global physical supply; and AI data centers, electric vehicles, and next-generation solar panels all require silver in ways that are difficult to substitute. Industrial buyers are price-insensitive in a way speculative buyers are not. The result was a 34% surge in early 2026 including a $121 intraday high in late January, followed by a pullback to the low $90s.
Data and Tools
All data pulled programmatically in Python using yfinance — silver futures (SI=F), gold futures (GC=F), VIX (^VIX), and the US Dollar Index (DX-Y.NYB) from January 2020 through February 27, 2026 (1,547 trading days). Modeling used statsmodels for OLS/WLS regression, NumPy for Monte Carlo simulation, pandas for time series handling, and matplotlib for visualization. Full script available on GitHub.
Gold/Silver Ratio
Historical average ratio (2020–2026): 82.6:1. Current ratio: 56.4:1 (gold $5,230, silver $92.68). Z-score: -2.56, meaning silver is statistically expensive relative to gold. This is a genuine bearish signal and was included as a regression factor — however it was not statistically significant in the recent 6-month window (p=0.448), suggesting the historical ratio may no longer be the right anchor in the current structural regime.
Multi-Factor Regression
Daily return regression over the most recent 6 months (126 observations): ret_silver = α + β₁·ret_gold + β₂·ret_vix + β₃·ret_dxy + β₄·lagged_ratio_z + ε
| Factor | β | p-value | Significant? |
|---|---|---|---|
| Gold daily return | +2.290 | <0.001 | ✓ Yes |
| VIX daily return | -0.040 | 0.250 | ✗ No |
| DXY daily return | -0.039 | 0.962 | ✗ No |
| Lagged gold/silver ratio z-score | +0.002 | 0.448 | ✗ No |
R² = 0.717. Gold alone explains 72% of silver's daily return variance over the last six months. The beta of 2.29 means silver amplifies gold's moves by more than 2x. Only gold was used to adjust Monte Carlo drift.
Monte Carlo Simulation
Macro-adjusted drift based on gold's 30-day average return came to 1.008%/day — capped at 0.4%/day to prevent parabolic extrapolation while preserving directional signal. Residual volatility: 2.80%/day. 10,000 daily price paths simulated from February 27 to April 30 (42 trading days). Maximum price in April extracted per path. Distribution winsorized at 5th/95th percentiles.
Results
| Statistic | Value |
|---|---|
| MC Mean April High | $116.12 |
| MC Median April High | $115.03 |
| 10th percentile (downside) | $96.91 |
| 25th percentile | $104.73 |
| 75th percentile | $126.43 |
| 90th percentile (upside) | $137.70 |
| Submitted forecast | $115 median, $105–$126 (80% CI) |
Risks
Bullish: China export controls; US Critical Minerals designation; AI/EV/solar structural demand; weak dollar (DXY 97.6); moderately elevated VIX.
Bearish: Gold/silver ratio z-score -2.56 (silver expensive vs gold); solar manufacturers cutting silver intensity -7% YoY; parabolic 6-month move raises mean-reversion risk; deficit may already be priced in.